Friday, June 6, 2014
BQ 7: Unit V
The formula for the difference quotient is f(x+h)- f(x) divided by h. It is derived from the slope formula of y^2-y^1/x^2-X^1. The only difference is that as seen on the graph the section of x+h is substituted in the place of y^2 and then y with x. Next its done the same with the bottom leaving it as x+h-x. Next you move on by canceling out the x's leaving the h on the bottom. So its simply substituting in the correct values into the slope formula resulting in the difference quotient. This all being shown in the image provided. The image shows how delta x can be used as another notation for the h. The purpose always being to get delta x as small as possible, making the tangent line less steep. Because the smaller the delta x, the more the secant and tangent lines resemble one another.
Monday, May 19, 2014
BQ#6: Unit U
1. What is continuity? What is discontinuity?

Continuity means that the graph is predictable. Also it has no breaks, holes, or jumps, and it can be drawn without lifting the pencil off the paper.

Point Discontinuity

Oscillating Behavior

Jump Discontinuity

Infinite Discontinuity
Discontinuities can be seen in graphs when it has point, oscillating, jump, and infinite discontinuities. Within these discontinuities there are two groups, removable and non-removable discontinuities. A type of removable discontinuity is a point discontinuity. This means that there's a hole in the graph(as seen in the first graph). Non-Removable discontinuities consists of jump discontinuity, oscillating behavior, and infinite discontinuity. Jump discontinuity means that if we trace the graph with our left and right finger on the graph and get to different points(third picture). It is important to know that the jump can have two open circles, one close/open, but they must never be two closed circles. Oscillating behavior is also part of non-removable discontinuities. In oscillating behavior the graph is very wiggly, or unpredictable. In this case the limit dne because you can't really cant tell where the graph's next destination will be. Infinite discontinuity is the last part of non-removable. This is when there's a vertical asymptote leading to unbounded behavior. Unbounded behavior means the graph is either going up infinitely or down infinitely (last picture)
2. What's a limit? When does a limit exist? When does a limit DNE? What's the difference between limit and value?
3. How do we evaluate limits numerically, graphically, and algebraically?
To begin numerically means on a table. So with this in mind we evaluate a limit numerically by making an x and y table with seven spaces. Then we write the limit in the middle box. Afterwards we come up with the x values by adding and subtracting 1/0. Once we have that we plug in the function and trace the numbers that we have on the table (x-values). Once we plug in the limit if the calculator does not give us an answer then it is undefined. For algebraically there are three methods that can be used. The first method is substitution. In this method we just plug in the limit and solve. There are three answer that we can get which are a number, a zero divided by a number which is zero, a number divided by zero which is undefined, and 0/0 which is indeterminate form. If we get indeterminate form we have to use the dividing/factoring method or rationalizing/conjugate method. In the factoring method we have to factor the numerator and denominator and cancel like terms to remove the zero. Then with the simplified expression, use substitution to find the answer. The rationalizing/conjugate method is when you multiply the radical with its conjugate. Remember to not multiply the non-conjugate because something would hopefully cancel. Once something does cancel, you use substitution to get your answer.
 Factoring Method

 Rationalizing Method
A limit is the intended height of a function. A value is the actual height of a function. A limit exists when the intended and actual height are the same (value) . A limit is the value that a function or sequence "approaches" as the input or index approaches some value. A limit does not exist when the left and right are different(jump), unbounded behavior(vertical asymptote), and oscillating behavior.
Rationalizing MethodMonday, April 21, 2014
BQ #3: Unit T Concepts 1-3
How do the graphs of sine and cosine relate to each of the others?
1. Tangent
The ratio for tangent is sin/cos. So the asymptotes are located when tangent is 0, this would only happen when cos is equal to 0. Since cos is the x-value the asymptotes are located where x=0. That would be at pi/2 and 3pi/2. If we recall from the unit circle all trig functions in the first quadrant are positive. Both sin and cos are pos. in the first quadrant so that means that when you divide one by the other, you end up with a positive value for tangent. For quad.2 we know that sin is positive and cosine is neg. This means we get a negative value for tangent.in the third quad. sin and cos are both negative so we get a positive value for tan. In quad 4sin is pos and cos is neg. A and get a neg. value for tangent. The graph for tangent is pos, neg, pos, neg. When we graph it within its period and based on the location of the asymptotes it will be uphill or downhill.

The trig ratio for cotangent is cos/sin. So the asymptotes are located where sin is equal to 0(y). The asymptotes would be located at 0 and 180 because y=0 there.To find out how the appearance for cotangent graphs we can use the trig ratio for cotangent looks, we can use the trig ratio for cot (cos/sin). Sin and cos are positive in the first quadrant, so when you divide one by the other, you end up with a positive value for cot. For quadrant 2 we get a negative value for cot. For the third quadrant we get a positive value for cot. In the fourth quadrant 4,we get a negative value. The graph for cotangent is pos, neg, pos, neg. When we graph it within its period of 0 and pi, the graph will begin close to the asymptote above the x-axis. When it enters second quad. it will be negative so we have to draw it downhill.
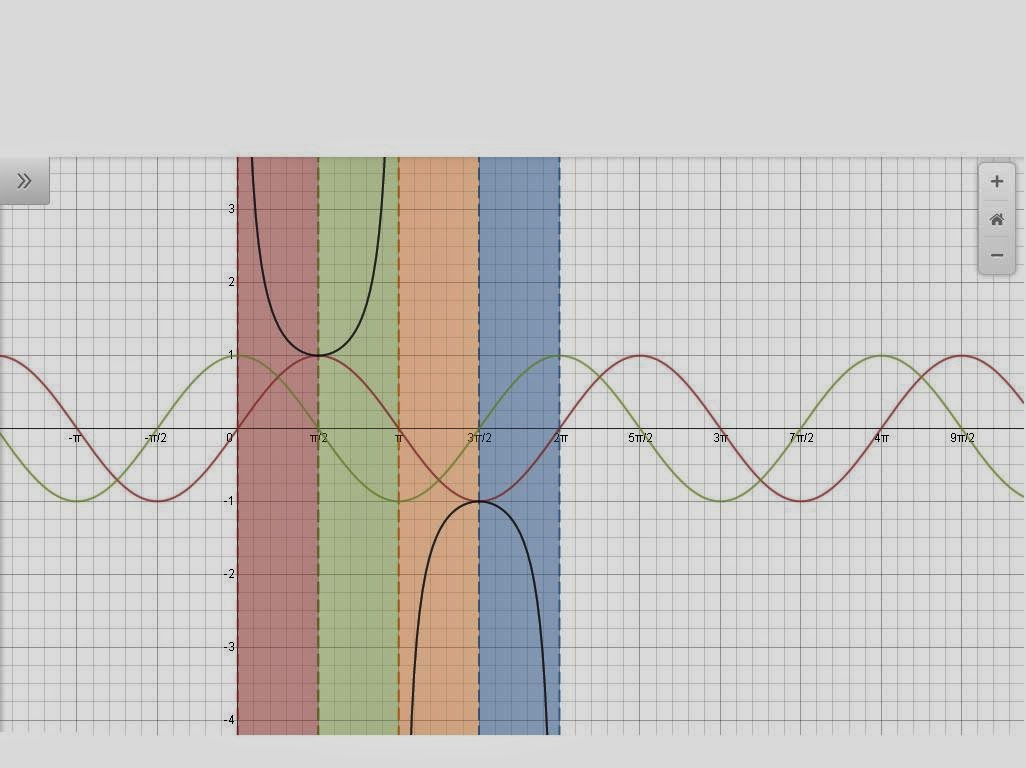
3. Secant
Secant is the reciprocal of cosine. It has a ratio of 1/cos. Since cosine is the denominator when it equals zero we will have asymptotes. Secant has asymptotes at pi/2 and 3pi/2(keep in mind that they go on forever to the left and right). These asymptotes are the only ones within the period. If secant is positive then the graph will go upward and if its negative the graph will go downward. Also if cosine is positive or negative secant will also.
1. Tangent
The ratio for tangent is sin/cos. So the asymptotes are located when tangent is 0, this would only happen when cos is equal to 0. Since cos is the x-value the asymptotes are located where x=0. That would be at pi/2 and 3pi/2. If we recall from the unit circle all trig functions in the first quadrant are positive. Both sin and cos are pos. in the first quadrant so that means that when you divide one by the other, you end up with a positive value for tangent. For quad.2 we know that sin is positive and cosine is neg. This means we get a negative value for tangent.in the third quad. sin and cos are both negative so we get a positive value for tan. In quad 4sin is pos and cos is neg. A and get a neg. value for tangent. The graph for tangent is pos, neg, pos, neg. When we graph it within its period and based on the location of the asymptotes it will be uphill or downhill.
2. Cotangent
The trig ratio for cotangent is cos/sin. So the asymptotes are located where sin is equal to 0(y). The asymptotes would be located at 0 and 180 because y=0 there.To find out how the appearance for cotangent graphs we can use the trig ratio for cotangent looks, we can use the trig ratio for cot (cos/sin). Sin and cos are positive in the first quadrant, so when you divide one by the other, you end up with a positive value for cot. For quadrant 2 we get a negative value for cot. For the third quadrant we get a positive value for cot. In the fourth quadrant 4,we get a negative value. The graph for cotangent is pos, neg, pos, neg. When we graph it within its period of 0 and pi, the graph will begin close to the asymptote above the x-axis. When it enters second quad. it will be negative so we have to draw it downhill.
 |
| https://www.desmos.com/calculator/hjts26gwst |
Secant is the reciprocal of cosine. It has a ratio of 1/cos. Since cosine is the denominator when it equals zero we will have asymptotes. Secant has asymptotes at pi/2 and 3pi/2(keep in mind that they go on forever to the left and right). These asymptotes are the only ones within the period. If secant is positive then the graph will go upward and if its negative the graph will go downward. Also if cosine is positive or negative secant will also.
 |
| https://www.desmos.com/calculator/hjts26gwst |
4.Cosecant?
Cosecant is the reciprocal of sine. It has a ratio of 1/sin. We get asymptotes when the denominator equals zero. Cosecant has asymptotes at 0 and pi (they keep going).If sine is positive so will the cosecant graph. Cosecant is also affected by that.
 |
| https://www.desmos.com/calculator/hjts26gwst |
Saturday, April 19, 2014
BQ #4: Unit T Concept 3
Why is a "normal" tangent graph uphill, but a "normal" cotangent graph downhill?
The normal tangent graph is uphill mainly because of the asymptotes. One of the reasons why its uphill is because of the asymptotes which are located at pi/2 and 3pi/2 (keep in mind they go on forever). If we recall from the unit circle the first quadrant was positive, the second negative, the third positive, and the fourth negative. So if we draw our asymptotes our graph has to be in between those asymptotes so that means where in the third and second quadrant. As mentioned above the third quadrant is positive and the second one is negative. So that means our graph has to be below the x-axis and then above the x-axis.
 The normal cotangent graph is downhill because of its asymptotes. The asymptotes for the normal cotangent graph are pi and 0. The labeling of the quadrants is the same. So it would be above the x- axis and then below as seen below.

The normal tangent graph is uphill mainly because of the asymptotes. One of the reasons why its uphill is because of the asymptotes which are located at pi/2 and 3pi/2 (keep in mind they go on forever). If we recall from the unit circle the first quadrant was positive, the second negative, the third positive, and the fourth negative. So if we draw our asymptotes our graph has to be in between those asymptotes so that means where in the third and second quadrant. As mentioned above the third quadrant is positive and the second one is negative. So that means our graph has to be below the x-axis and then above the x-axis.
Thursday, April 17, 2014
BQ#5: Unit T: Concepts 1-3
Why do sines and cosine NOT have asymptotes, but the other four trig graphs do?

To begin the ratio for sine is y/r and for cosine its x/r. If we recall r is 1 so that means that r can never equal 0 so we can't get an asymptote. We cannot get an asymptote because in order to get an asymptote we have to get an undefined and we can only get an undefined when we divide by zero. Cosecant has a ratios of r/y and cotangent has a ratio of x/y. This means that we will get asymptotes when y=0. Also the asymptotes will be in the same place. The ratios for secant (r/x) and tangent (y/x) both end with x. So we get asymptotes when x=0. All trigs, except for sine and cosine, can be divide by zero this means that we can get an undefined and have asymptotes on the graph.
To begin the ratio for sine is y/r and for cosine its x/r. If we recall r is 1 so that means that r can never equal 0 so we can't get an asymptote. We cannot get an asymptote because in order to get an asymptote we have to get an undefined and we can only get an undefined when we divide by zero. Cosecant has a ratios of r/y and cotangent has a ratio of x/y. This means that we will get asymptotes when y=0. Also the asymptotes will be in the same place. The ratios for secant (r/x) and tangent (y/x) both end with x. So we get asymptotes when x=0. All trigs, except for sine and cosine, can be divide by zero this means that we can get an undefined and have asymptotes on the graph.
Wednesday, April 16, 2014
BQ #2: Unit T Concept Intro
1. How do the trig graphs relate to the Unit Circle?

The trig graphs relate to the Unit Circle because it uses the negative and positive values of the quadrants in order to define how a period/graph will look for a certain trig function. Each trig function forms a different looking graph. To begin the unit circle unfolds into a line. As we can see above the signs in parenthesis are the values that that quadrant would have on the unit circle (positive or negative). Since we unfolded the unit circle for the sine graph we are left with positive and on the left and negative on the right. This means that our graph will look like an uphill then a down hill. For the cosine we see an uphill, downhill, and then uphill again because of the positive, negative, negative, and positive value on the quadrants when we unfolded the Unit circle. Tangent/cotangent both have an uphill and downhill because they have a shorter period due to the positive and negative on the first two quadrants and positive negative in the third and fourth quadrant.
-Period? - Why is the period for sine and cosine 2pi, whereas the period for tangent and cotangent is pi?
The period for sine and cosine is 2pi because it takes four quadrants to repeat the same pattern over and over again. Tangent and cotangent has a period of pi because since it already has a positive and a negative value on the first two quadrants it only takes pi to repeat the pattern.
-Amplitude? - How does the fact that sine and cosine have amplitudes of one (and the other trig functions don't have amplitudes) relate to what we know about the Unit Circle?
The fact that sine and cosine have amplitudes of one relates to what we know about the unit circle because sine and cosine cannot be bigger that one. Since sine and cosine has a ratio of y/r and x/r and r =1. Sine and cosine can only be between -1 and 1.
Thursday, April 3, 2014
Reflection#1: Unit Q Concepts 1 & 5
1. To begin proving an identity is very different from solving a problem. To prove an identity, you have to use identities to show that one side of the equation can be transformed into the other side of the equation. You don't plug values into the identity to prove anything. There are several different identities you can plug in. We also have to keep in mind that we can not touch the right side when verifying.
2. One of the main tricks that I found useful were trying to maintain sin and cos in the problem. Another trick that I found helpful was knowing when to combine and break up fractions so that the number of terms will match. The last trick that I found helpful was factoring out the GCF.
3.There are several ways that we can approach a problem. However, there are several things that we can do first such as looking for a GCF, substituting an identity, multiplying by the conjugate(when the denominator is a binomial), combine fractions with binomial denominators, and factoring.
Subscribe to:
Posts (Atom)